Any Human Ever Draws One Life at Random From 100 Billion People Who Lived
The project picks a year, a place and a life at random from real demographic data, then tells the story. Its sources page documents 326 works supplying 87,830 rows — each labelled by how it was obtained.
A new website called Any Human Ever turns demographic and historical data into a single, randomly drawn life. Its front page states the premise in one line: "Over 100,000,000,000 people have ever lived. Choose one." The visitor presses a button and the site selects a year, a place and a life step by step — each taken at random from real data — then tells the resulting story. The site's own description promises that every detail is sourced.
How the draw works
The first stage is the birth year. Almost everyone who ever lived was born recently, the site explains, because population grew exponentially, so a random birth is far more likely to fall near the present; the argument is illustrated with a population graph that can be switched between a logarithmic and a linear time axis. The second stage is a location, shown on a world map where brighter clusters represent more people. The third adds demographic figures and a timeline, and the fourth presents the story with an explicit note that the person drawn is not a real individual.
Illustrations stay opt-in
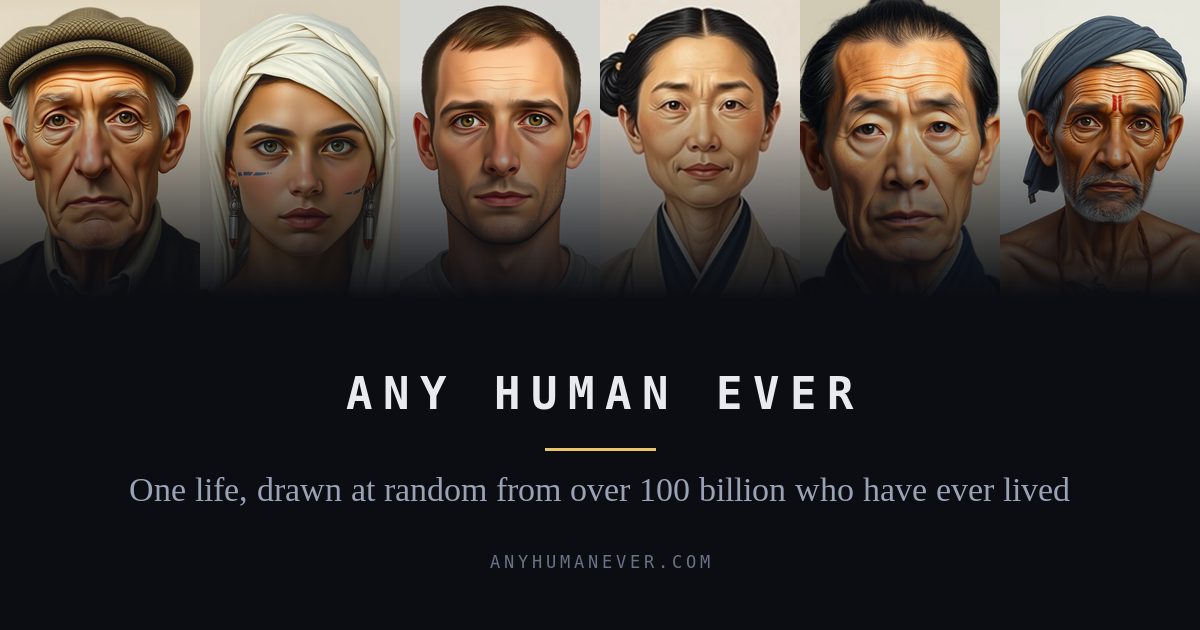
An illustration is offered for each life but remains hidden until a switch is turned on. The site notes that the images are made with the FLUX.1-schnell model on the author's own laptop, and the caption carries that caveat. Lives drawn in a browser are kept locally, with a gallery that holds up to 100 of them and a shareable permalink for each.
Where the data comes from
The sources page lists 326 datasets and works of scholarship supplying 87,830 rows across 80 tables, and labels every row by provenance. Extracted rows (72.0% of rows, 14.2% of the citations a reader sees) came from a table downloaded from the cited publisher. Derived figures (11.1% / 1.5%) are calculated from cited numbers, with the arithmetic written into each row. Attributed values (7.7% / 47.6%) were written by a model claiming that the cited source says so. Context rows (3.7% / 22.5%) use a source for its categories while a model sets the number. Authored facts (5.6% / 14.1%) are asserted by a model with no citable source and are registered together under the identifier RH109. The shares were measured over 200 lives on 21 September 2026. The largest category of sources is family, work and society with 85 entries, followed by climate and sky (66), belief, language and burial (57); war and conflict is represented by a single source.
Why it was built
On its about page the project argues that written history is a biased sample: more is known about the sequence of Frankish kings than about an ordinary peasant's routine in fifth-century Avignon, even though most lives ever lived were Asian, poor and brief. The question the project poses is what would happen if stories were drawn from actual data and randomised to represent the human past fairly. It quotes the poet Muriel Rukeyser: "The universe is made of stories, not of atoms."
SiTech — AI-powered web development
We build fast, modern websites and bring AI into real business workflows. Have a project or a question? We'd love to help.