Why your local LLM feels dumber than it is: the inference stack's hidden quality losses
A series of experiments on the Level1Techs forum shows that a local model's apparent stupidity often comes from attention backends, KV-cache quantization and tensor parallelism — not from the model itself.
A series of experiments posted on the Level1Techs forum shows that a locally run model often looks weaker than it actually is — and the cause is frequently the inference stack rather than the model. The thread's author, a user known as thr3e, runs the same weights under different runtime settings and measures where the outputs start to diverge.
No two implementations are the same
The author uses the term "reference implementation" for the lab that publishes a model, hosts it first-party and posts the original benchmark claims: its hardware and software differ from yours. Home setups often mix GPU generations, and different instruction sets compute the math for the next token differently even with identical weights. The nightly vLLM container used in the tests shipped 734 packages, 252 of them Python — 734 codebases, each with its own bugs and undocumented behaviour.
Three tests: backends, KV cache, quantization
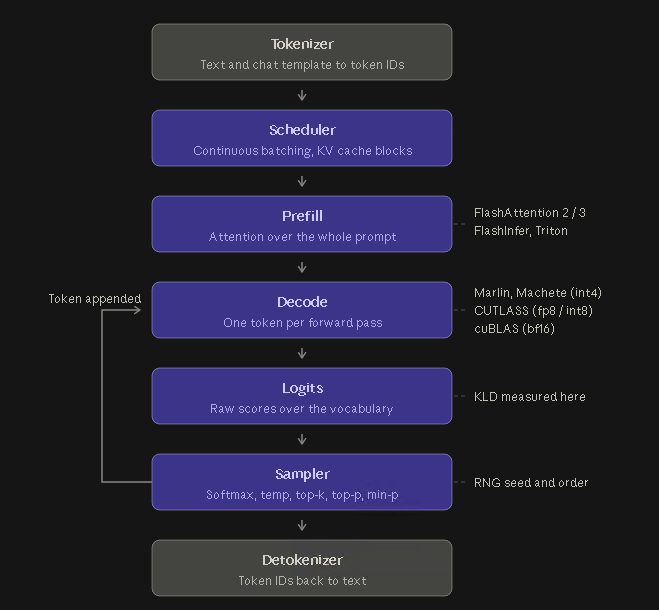
The first test compared three attention backends — FlashAttention 2, Flash Inference and Triton Attention — with Qwen3.6-27B in BF16 on an RTX PRO 6000 Blackwell, changing nothing else. The workload was a roughly 100k-token context captured from a real workstream with tool calls. For the first few thousand tokens every backend agreed; later in the prompt they started to disagree. Repeating the same backend produced bit-for-bit identical logits, so the divergence comes from the prefill math rather than random noise.
The second test quantized only the KV cache: int8 eventually recovered from the resulting tool-call error, int4 did not. The third compared five weight formats: INT8 W8A16 scored best, while Nvidia's NVFP4 came last, with about 50% of tokens flipped by 88k context. NVFP4 and AWQ W4A16 both ran the wrong Cisco command — 'show run' where 'show arp' was required.
One flipped token, one failed task
In part two the author captured 100% of the logits during tool calls and branched the generations to see where each version went. In one case a FlashAttention 2 run targeted GigabitEthernet0/1/4 instead of GigabitEthernet0/0/1.201, then ran 'show run' instead of 'show mac address table'; in another it failed to set an interface description at all. With tensor parallelism the same task passed at TP1, failed at TP2 and passed again at TP4 — which, on deeper debugging, usually points to NCCL.
How to measure properly
The thread's advice is to run standard benchmarks that are representative of your actual workload: cranking temperature to zero and pasting three test prompts is not a good analogue of agentic work, which needs long-context tool calling and domain-specific checks. Use the sampler settings and chat template from the model card — a temperature set too low is why some models loop inside their THINK output. Commenters also flagged that KL divergence measures how far a distribution moved from a baseline, not correctness, and is directional; top-1 disagreement is a separate, stricter measure. BF16 is a numerical-fidelity reference, not an oracle: a quantized model can diverge from it and still produce a better answer.
SiTech — AI-powered web development
We build fast, modern websites and bring AI into real business workflows. Have a project or a question? We'd love to help.